Data Analytics in Football - Defining the Playing Styles of Singapore PL Teams
31 May 2023 - 2 min readFrom August 2022 to May 2023, I had the opportunity to work on my first research project as a participant of NTU’s URECA1 program. I’ll write a full recap of my journey as an undergraduate researcher after the next academic year, but in many ways, this was the perfect project for me. It allowed me to work on a field that I have been passionate about for many years - sports analytics in football.
Working with Assoc. Prof John Komar from NIE2, we built an Expected Goals model from the last three seasons of Data in the Singapore Premier League, and applied it on top of research conducted by another URECA student to identify which styles of play are effective in Singapore and which teams use them the most.
The full paper and my findings are below if you’re interested in taking a look at it! If there’s interest in an in-depth runthrough of the code that I wrote for it, I’ll be happy to write that up as well.
Expected Goal Model
Input Variables
- X Coordinate of the Shot
- Y Coodinate of the Shot
- Euclidian Distance from the Center of the Goal
- Angle of the Shot from the Center of the Goal
Coefficients
| Variable | Value |
|---|---|
| Intercept | 0.2204 |
| X Coordinate | -0.0281 |
| Y Coordinate | -0.0062 |
| Distance | -0.0998 |
| Angle | -0.0081 |
Try clicking on different parts of the pitch below to explore how expected goals vary based on shot location:
Additional Plots
I wasn’t able to add all of these visualisations into the final paper, so I am taking this opportunity to share them here. I’ve always been impressed by the way publications like The Economist present their data, and I wanted to try to replicate that. While making these graphs, I realized that data visualization is really a labor of love, with so much fine-tuning needed in Python to get a graph looking just the way you need it to.
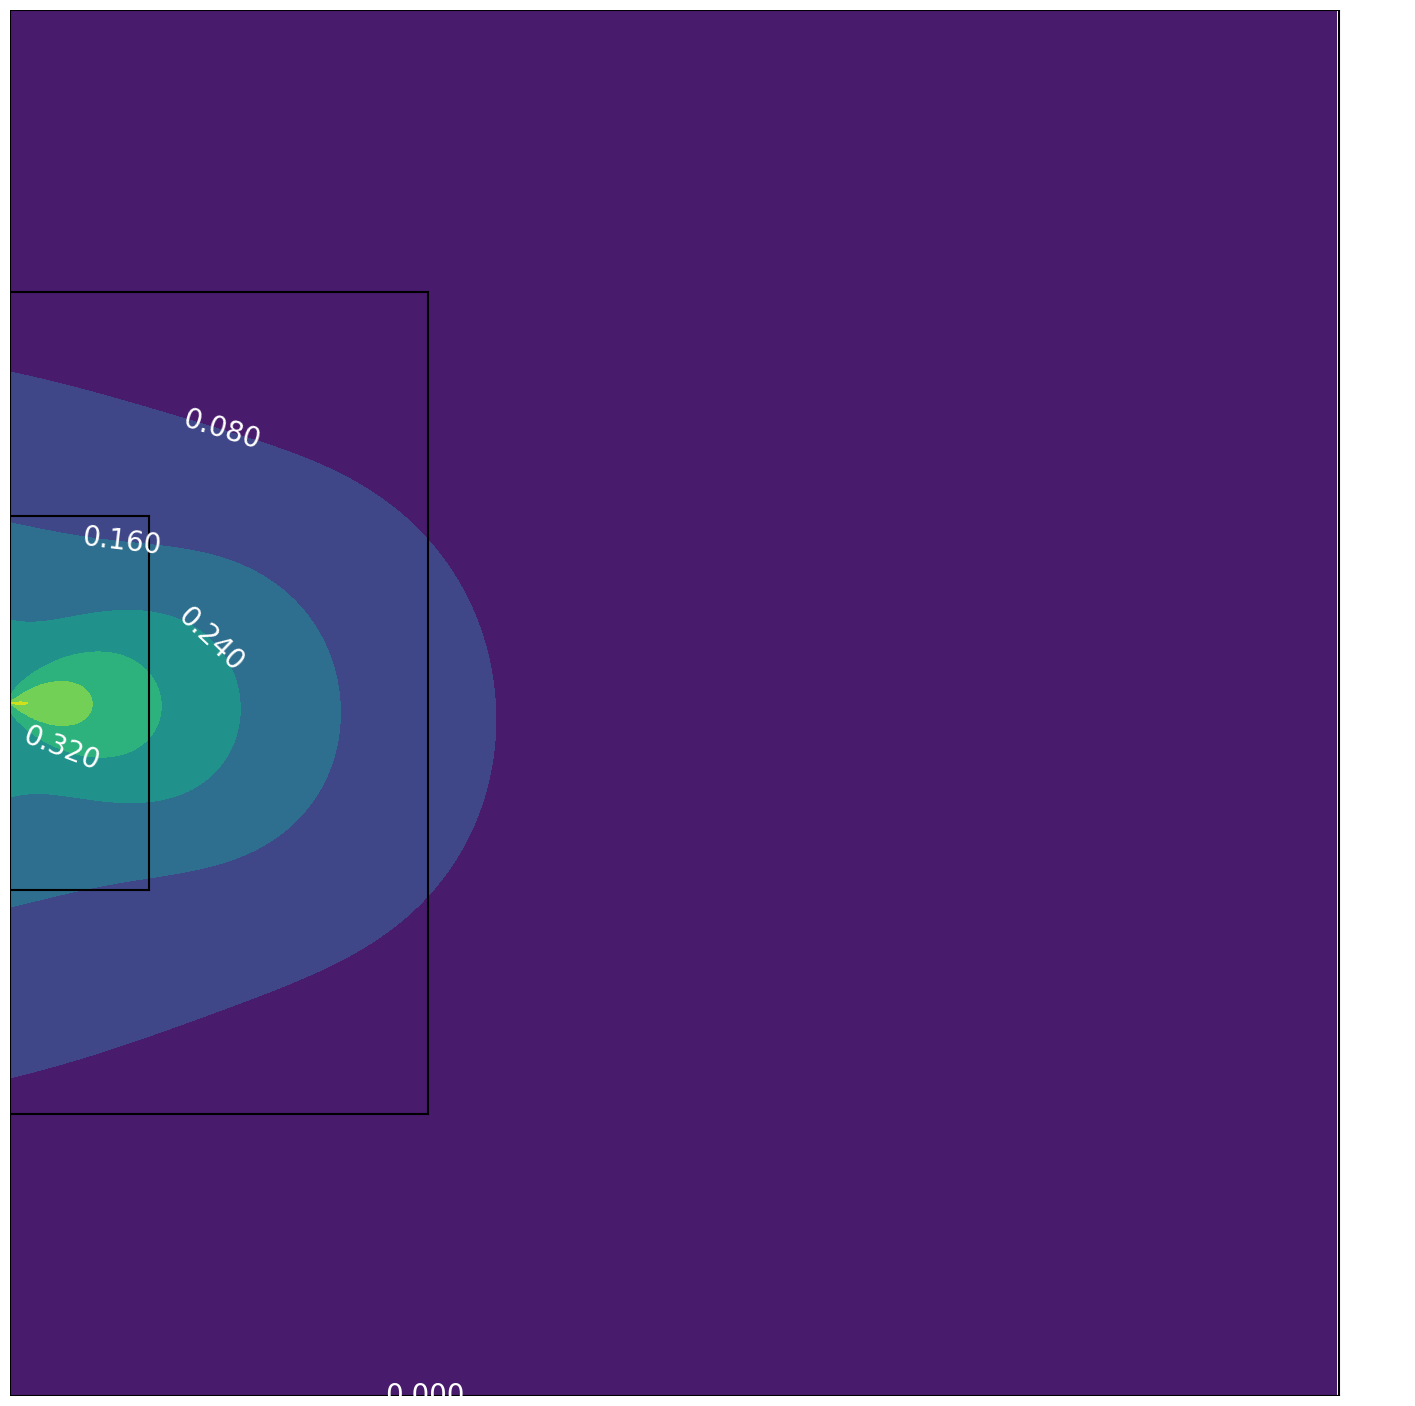
Expected Goals Heat Map
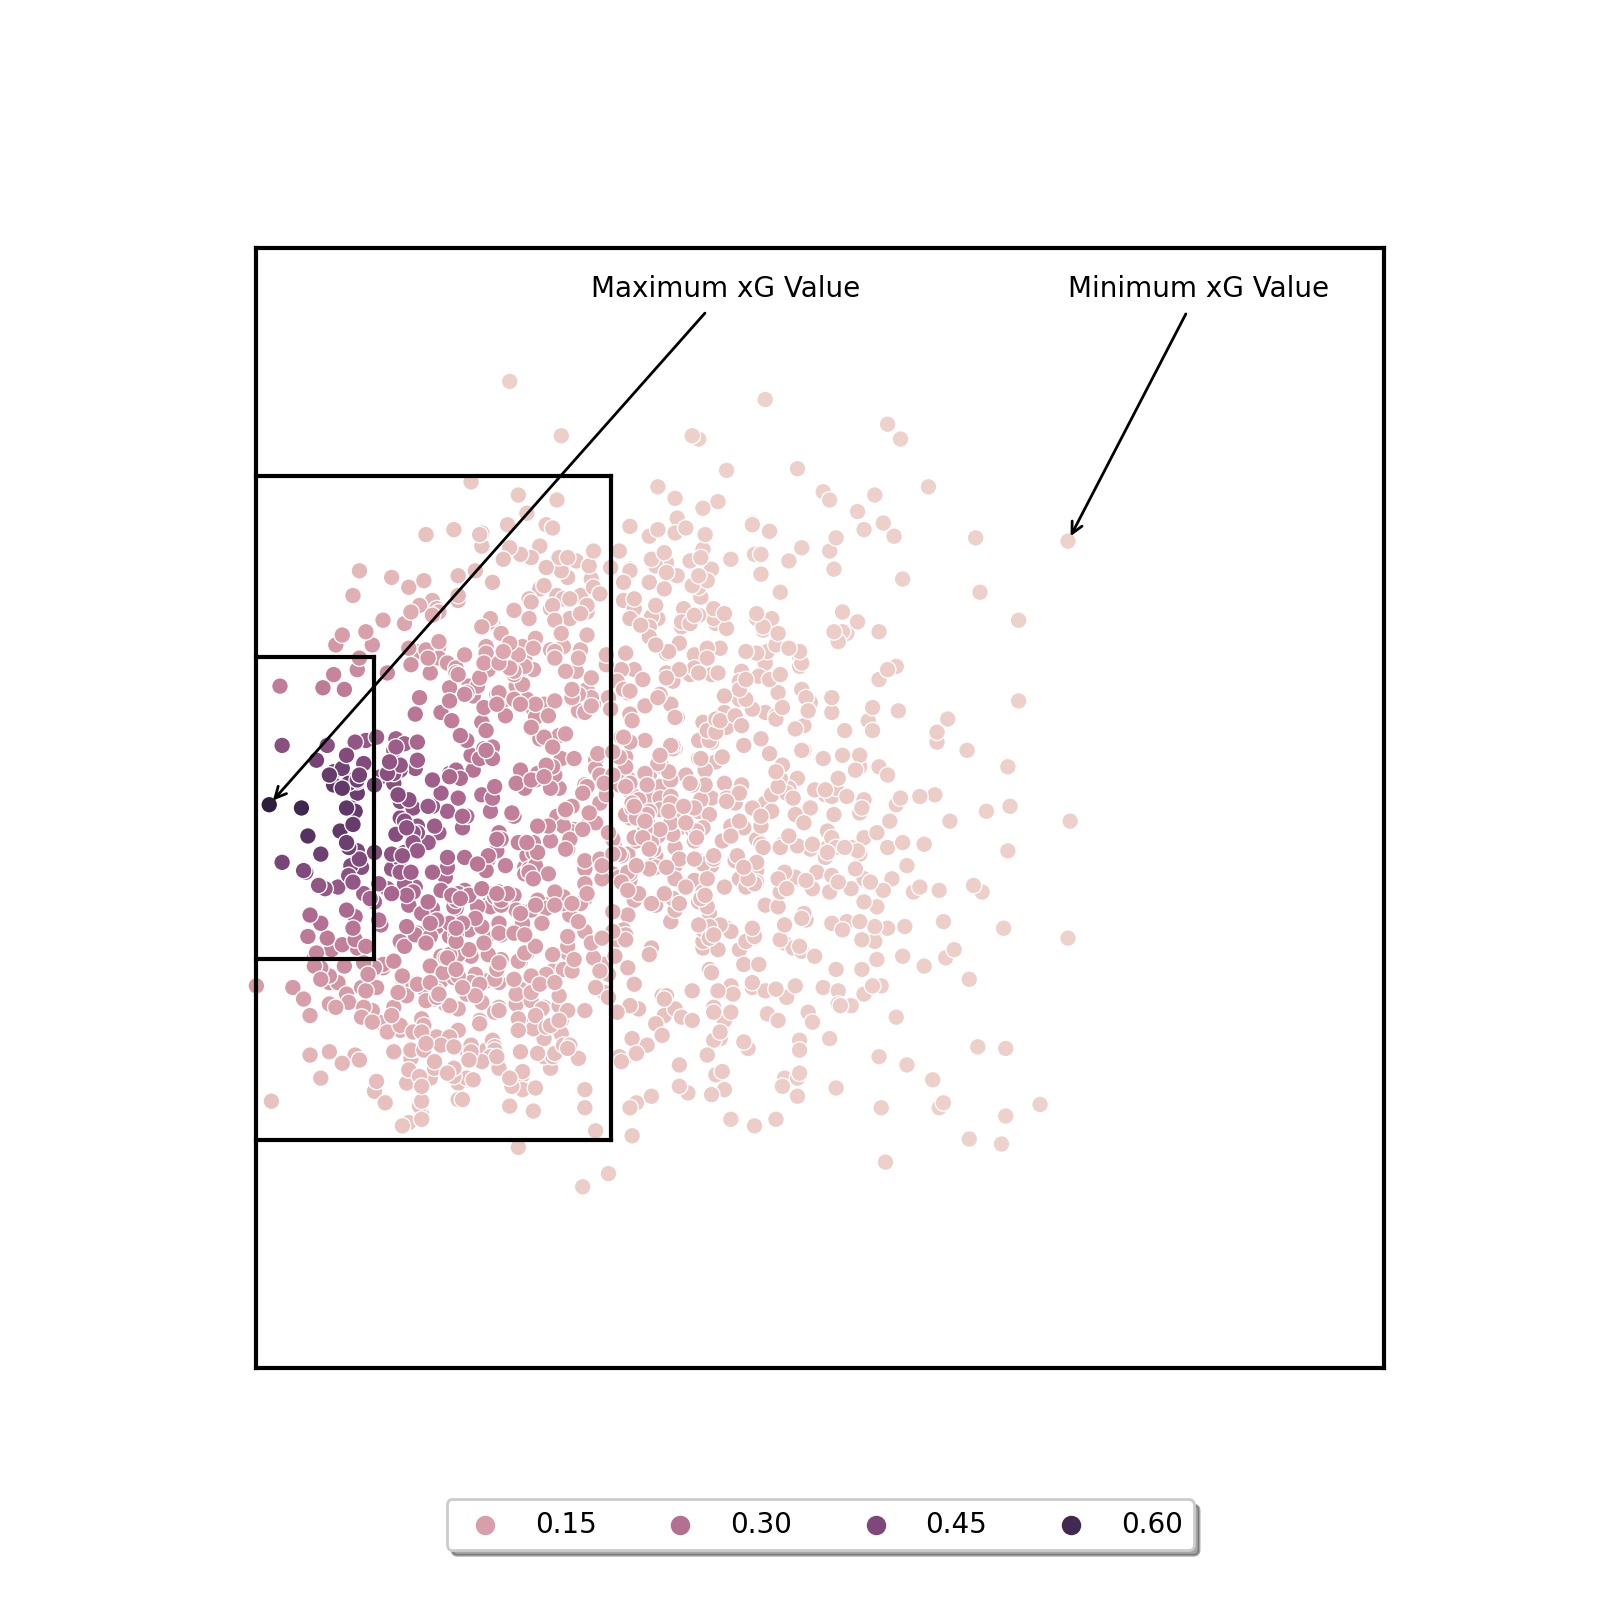
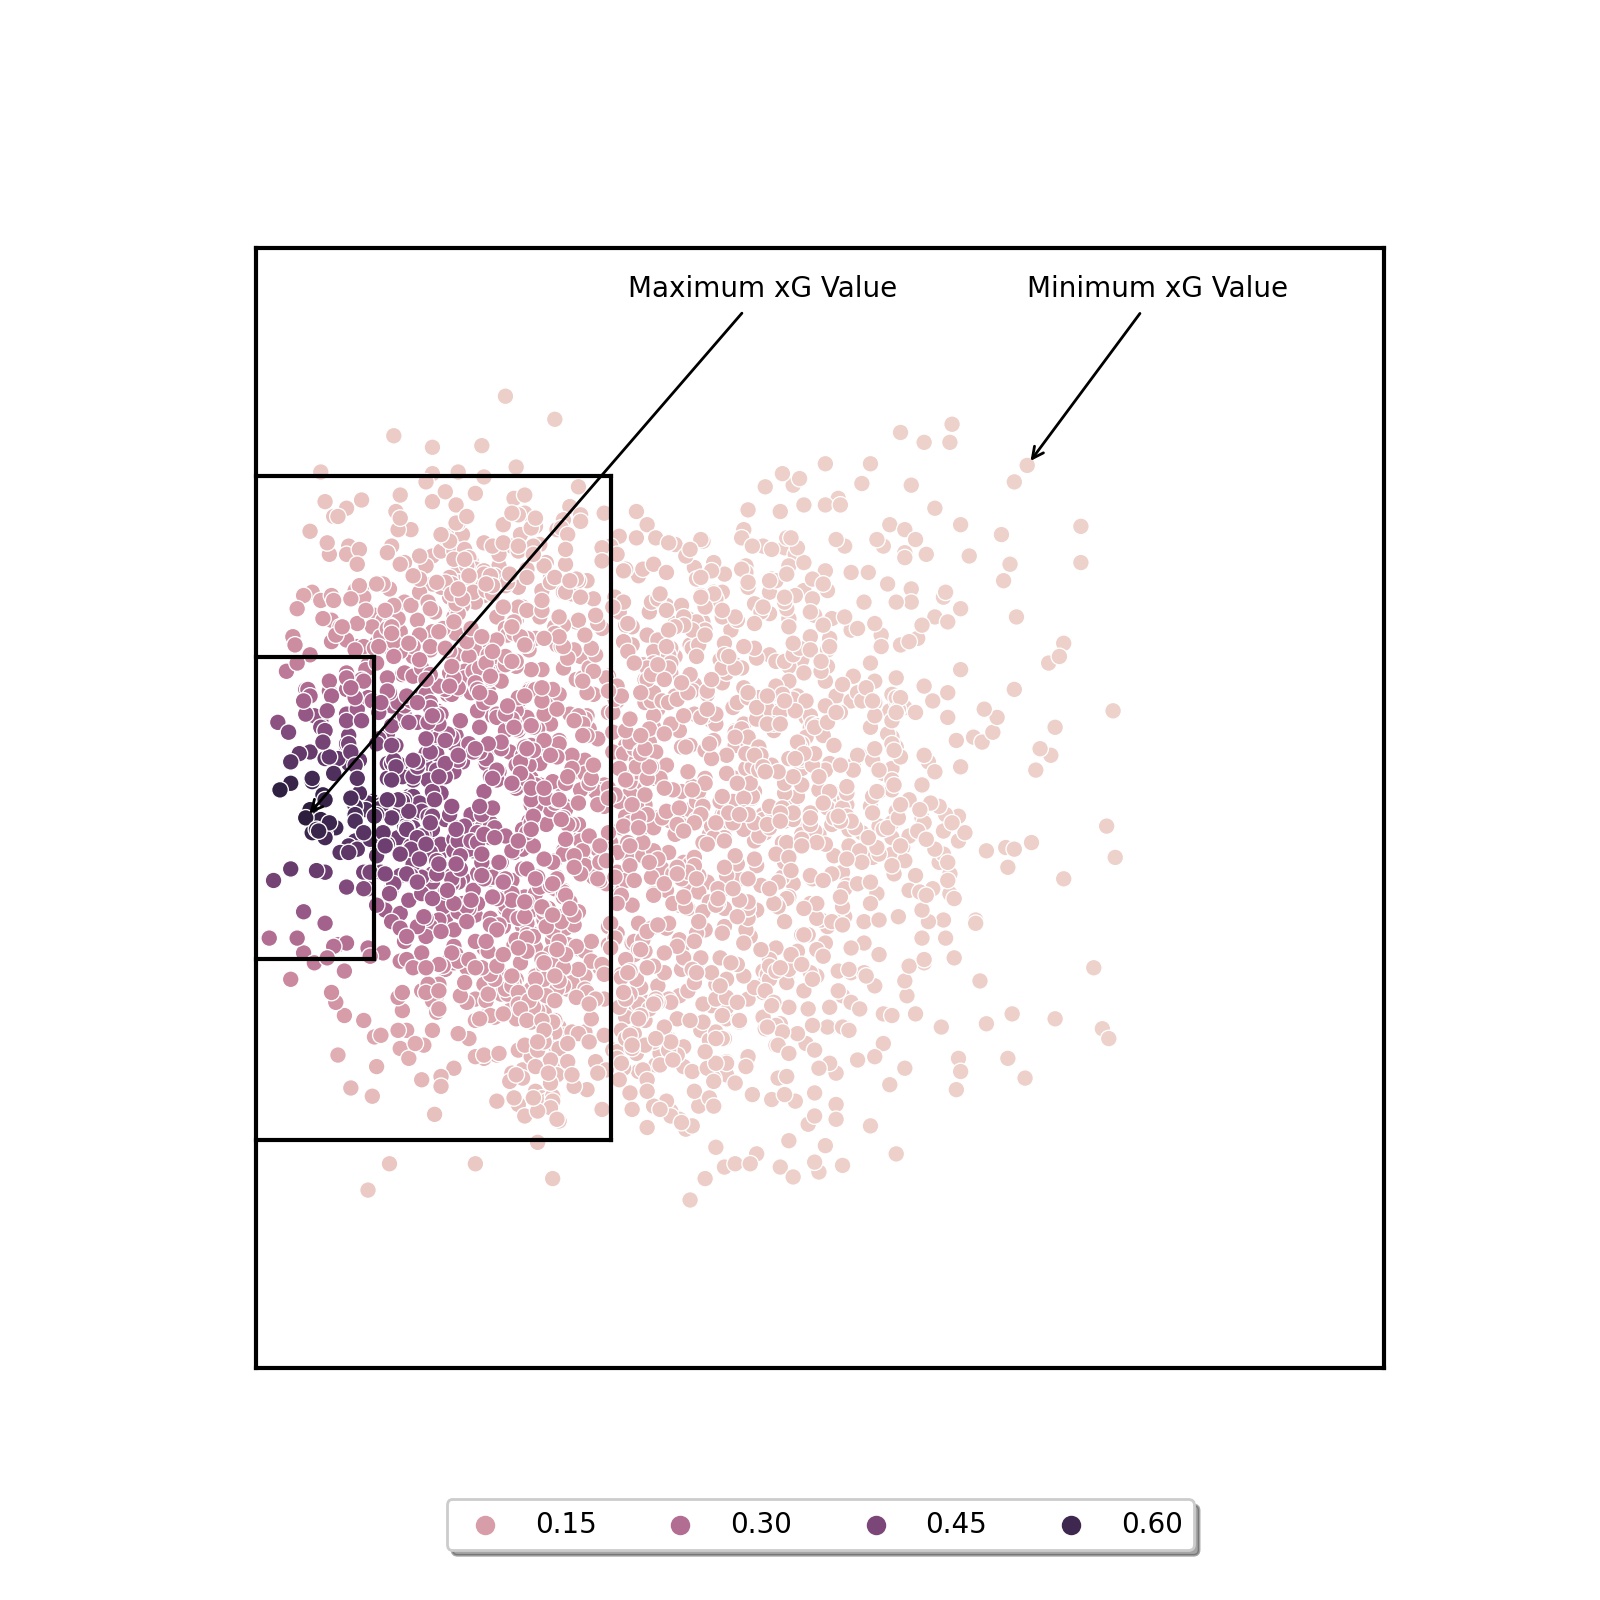
Expected Goals from Left Footed Shots vs Right Footed Shots
Left Footed Shots
Right Footed Shots
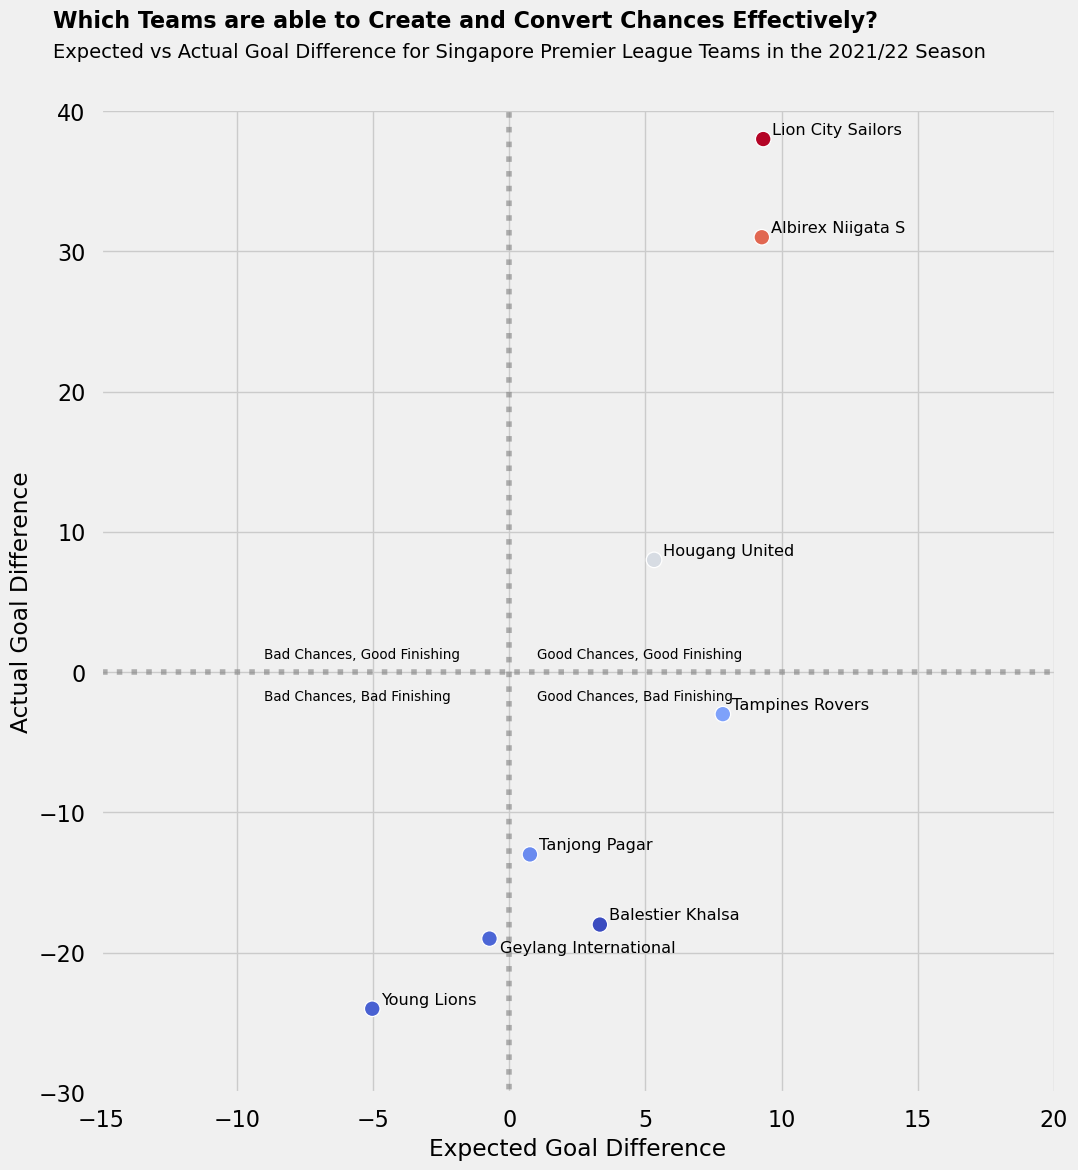
Expected Goal Difference vs Actual Goal Difference
2018-2019
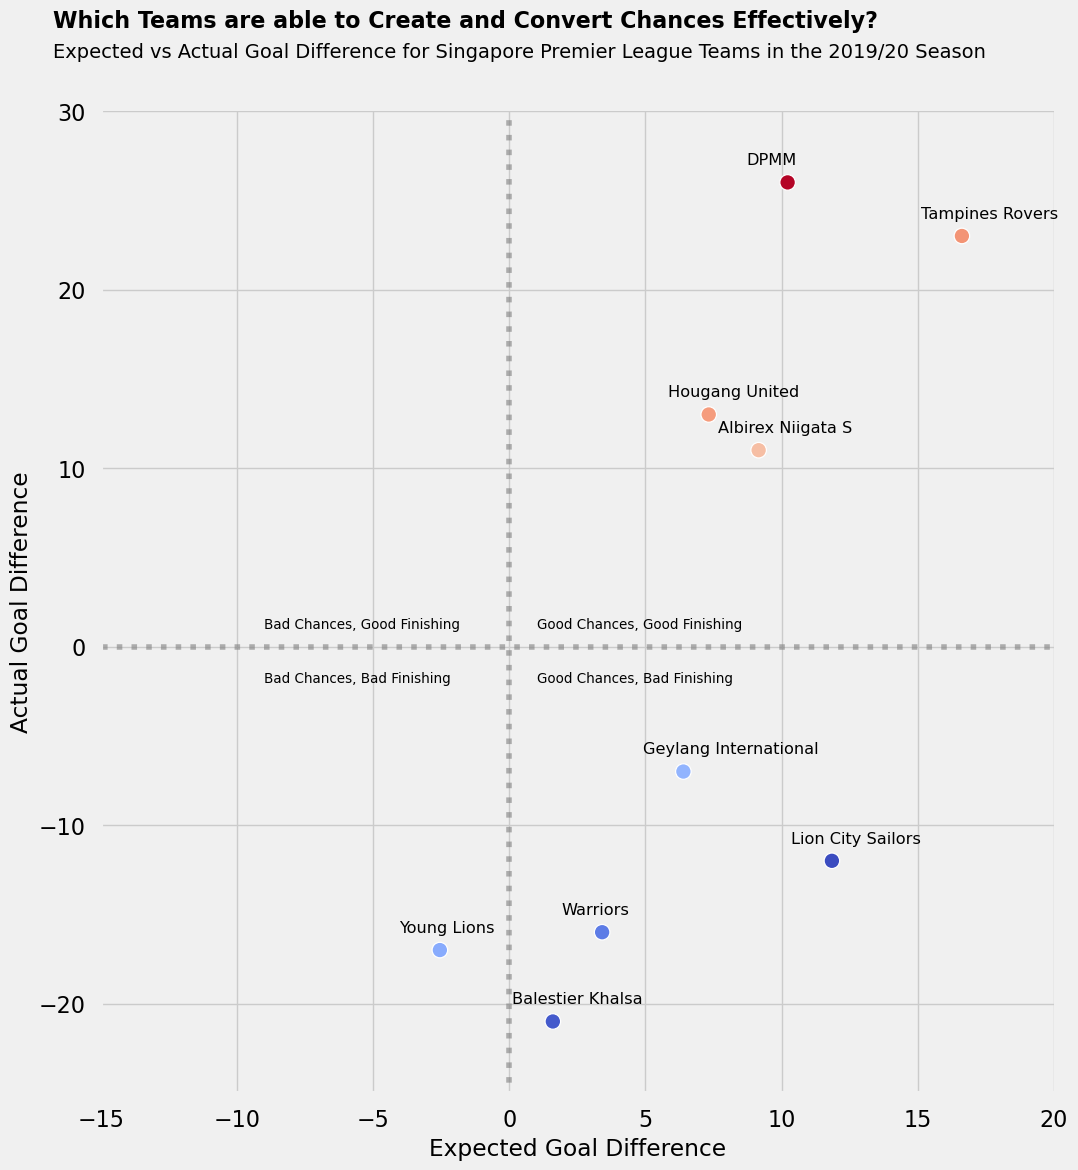
2019-2020
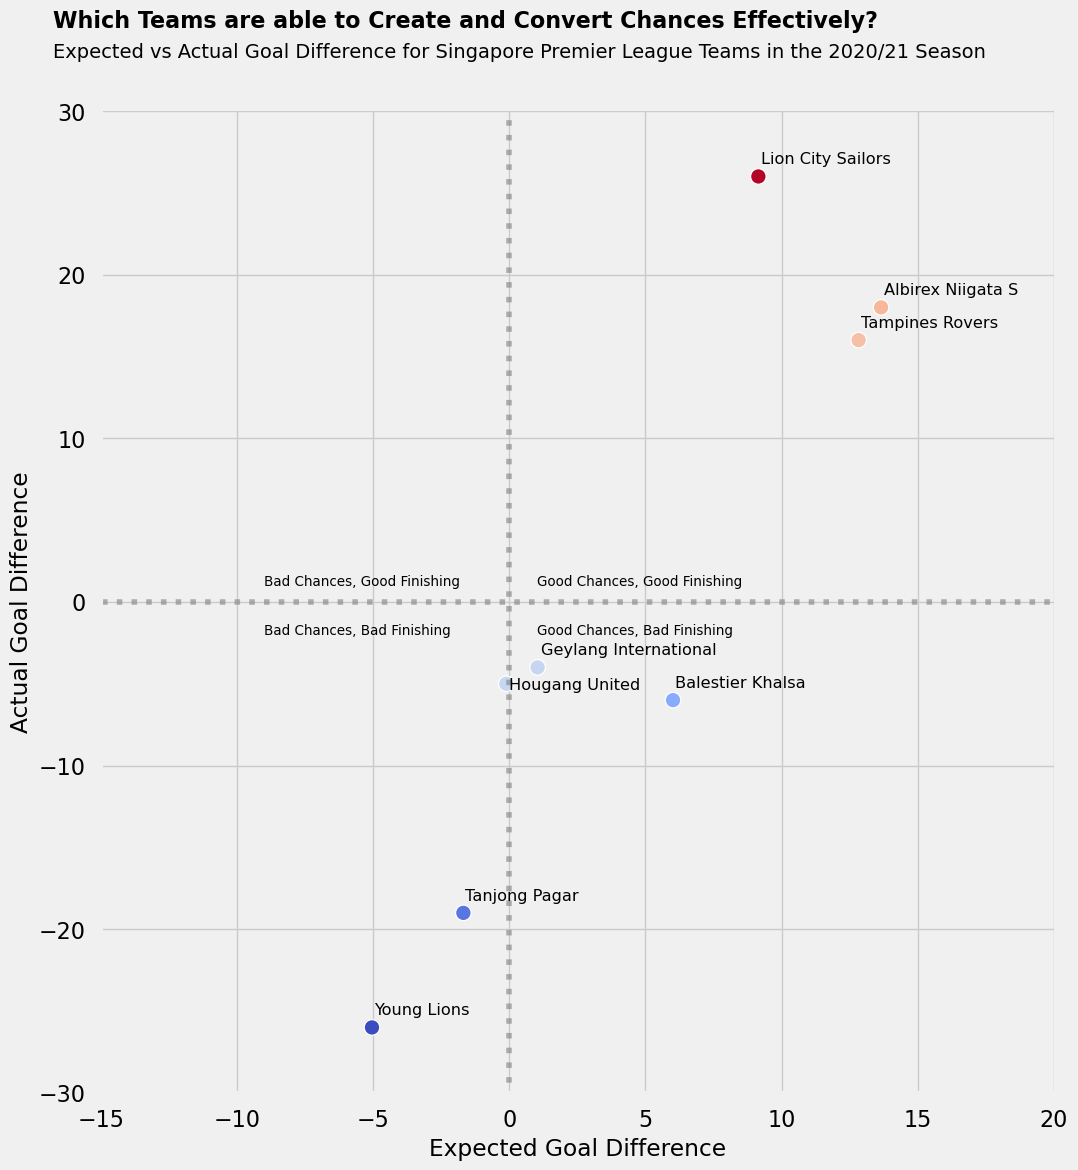
2020-2021
Paper
If you’re interested in reading the full paper detailing the methodology and findings of the xG model and decision tree outputs, you can find it here.
[1] - Undergraduate Research Experience on Campus
[2] - National Institute of Education